All Insights
Venture
Drug Innovation Is Global and Built on Shared Risk
Jonathan Yeh
8/19/2025
15 minutes


In recent months, debates around drug pricing, executive orders for Most-Favored Nation (MFN) pricing policies, and notable cuts to government research funding in the United States have reignited questions about how the global biopharmaceutical ecosystem is financed and what drives innovation. Accordingly, thoughtful perspectives from a variety of sources have highlighted the financial dynamics that sustain drug development, especially the disproportionate revenue contributions of the United States market. Two recent examples include thought-provoking articles by Kate Ho and Ariel Pakes [1], two economists from Harvard, and from RA Capital’s Peter Kolchinsky and Richard Xie [2], all of whom argue that the United States drug pricing system currently underwrites much of global pharmaceutical innovation, and rather than imposing domestic price controls that could stifle R&D investment, the United States should instead use trade policy, or access to the Medicare market, to pressure other countries to contribute more fairly to the cost of novel medicines. We share many of the same perspectives and believe that other wealthy nations should re-evaluate their pricing policies to further stimulate global R&D. That said, these debates have prompted us to reflect on the global nature of pharmaceutical innovation and to comment on the broader range of contributors beyond pricing alone.
Drug development is not only the product of a single payer, country, or commercial model but rather is the result of a global network of discovery science, translational infrastructure, capital markets, and regulatory systems. It is powered by both public and private investment, and it is built on shared risk across regions. Rather than framing the global pharmaceutical system as one where some countries bear all the cost and others passively benefit, it should be argued that drug innovation is global in origin, collaborative in development, and supported by contributions from several ecosystems. It is important to recognize the full value of early-stage investment, not just end-stage pricing.
Beyond Price: Measuring True Contribution to Innovation
There is truth to the idea that high United States drug prices stimulate investment. If other countries paid closer to United States levels, the global revenue base would expand, potentially enabling more ambitious and risk-tolerant R&D investment. By this logic, lower drug prices act to lower global revenues and disincentivize drug developers, thereby stifling innovation. Thus, it could be argued that other nations are disproportionately benefitting from high drug prices in the United States and not contributing their fair share to global drug innovation.
But this narrative is incomplete. It assumes a direct and linear relationship between pricing and innovation. The reality is one of mixed elasticity: some R&D is sensitive to pricing, but much is also driven by scientific opportunity, public funding, government subsidies, and capital markets. While some programs may be marginally viable depending on expected reimbursement, others proceed because of compelling biology, supportive government grants, or ecosystem-level enablers.
The core issue is not just how much countries pay for drugs but also how much they invest in the innovation cycle. Narratives focused solely on price miss this complexity. The groundwork for today's drug approvals was often laid 10 to 20 years earlier in publicly funded labs, startup incubators, or low-cost research parks around the world. A fair system does not require equal pricing everywhere, but it does require intellectual honesty about how and why innovation happens to properly stimulate and avoid myopic cost-cutting.
To understand the true architecture of global drug innovation, it is important to evaluate contributions through a broader set of metrics. These can include R&D expenditure per capita, the scale and accessibility of public subsidies dedicated to drug development, the availability and extent of private capital investment, the robustness of early clinical trial capacity, and the origin of first-in-class therapeutic discoveries. These dimensions provide a more accurate picture of which nations are shouldering the risk and cost of biomedical progress, especially at the earliest and most uncertain stages of development. Without these measures, international comparisons risk overemphasizing end-stage pricing while underrepresenting the inputs that make these outcomes possible.
2. Government Subsidies for Drug Development
Government subsidies play a critical role in stimulating early-stage drug development, particularly in the high-risk window between academic discovery and clinical proof of concept. These public investments, which take the form of grants, tax credits, and infrastructure funding, are designed to reduce the cost and risk of translating scientific advances into therapies. In doing so, they support national innovation capacity and provide leverage for private capital formation.
In the United States, a variety of subsidy programs support translational work. At the federal level, the SBIR/STTR program [4] allocates about $1 billion annually to early-stage biotech and medical technologies through the NIH, accounting for the largest share of awards, totaling $6.4 billion between 2018-2022 [5]. In parallel, state-level programs provide deeper and more targeted support. For example, the California Institute for Regenerative Medicine (CIRM) [5], has deployed over $3.86 billion in 1400+ grants since 2004 to fund stem cell and gene therapy programs across academia and industry, which in 2020 through California Stem Cell Research, Treatments, and Cures Initiative (Proposition 14) has been renewed for a further $5.5 billion [5]. In Texas, the Cancer Prevention and Research Institute of Texas (CPRIT) contributes an additional $200 to $300 million annually for oncology-focused translational work, deploying over $3.8 billion across 2090 awards since its inception in 2010 [6].
Japan’s approach has grown to be comprehensive, with the AMED Pharmaceutical Startup Ecosystem Strengthening Program [8] representing one of the most ambitious grant mechanisms in the world. The program supports biotech startups that have secured venture investment and are pursuing high-potential drug development programs. The grant covers up to two-thirds of total project costs, with a maximum of ¥10 billion (approximately $70 million) per award, providing a multi-year runway for projects to achieve IND milestones and generate clinical POC data.
We have experienced the direct benefit from this program, with two of our portfolio companies securing these subsidies. Optieum Biotechnologies, which is advancing next-generation CAR constructs with improved manufacturability and targeting precision, was awarded JPY 5 billion (~$39 million) from AMED in 2024. These subsidies support IND-enabling studies and has enabled a level of global expansion that would have been much more difficult if only relying on dilutive capital availability. United Immunity is developing a novel macrophage and dendritic cell targeting nanoparticle for the treatment of refractory solid tumors. AMED support is funding preclinical IND-enabling studies, GMP manufacturing of clinical materials, and the conduct of early-phase clinical trials in patients with advanced disease. In both cases, AMED’s backing has provided critical non-dilutive capital while reinforcing confidence among investors.
Beyond AMED, Japan’s Ministry of Economy, Trade and Industry (METI), in collaboration with its affiliated agency responsible for international trade and investment promotion, Japan External Trade Organization (JETRO), offers prestigious governmental recognition awards. METI also oversees the New Energy and Industrial Technology Development Organization (NEDO) and Small & Medium Enterprises (SME) Support Japan to operate programs that fund industrial-scale manufacturing infrastructure, digitalization of clinical development, and platform technology R&D. This substantial public support for therapeutic R&D now places the country among the top global contributors of early-stage biopharma subsidies [17].
Canada, Australia and the United Kingdom also play important roles through refundable tax credits and targeted innovation grants. In Canada, the Scientific Research and Experimental Development (SR&ED) program [9] allows eligible companies to claim 15–35% of qualified R&D expenditures. Similarly, Australia’s R&D Tax Incentive offers a refundable credit of up to 43.5% for eligible R&D expenses incurred by companies with an aggregated turnover of less than A$20 million [10]. This model allows pre-revenue biotech firms to receive cash refunds for qualifying R&D activities, regardless of product sales or capital raised. Many global companies have offset the cost of first-in-human clinical trials conducted in Australia by using this approach. Additionally, the U.K. offers the Research & Development merged scheme, under which loss-making companies can receive a cash credit of approximately 16.2% of eligible R&D expenditure [11].
Taken together, these programs form the financial backbone of early-stage drug development in their respective countries. They absorb technical risk, reduce dilutive capital requirements, and help startups generate the data needed to attract further investment or industry partnerships. Japan’s model, in particular, offers an integrated approach that ties public subsidy to private capital and strategic development goals, positioning it as a high-leverage contributor to global drug innovation.
3. Venture Capital Availability
A region’s ability to translate scientific discoveries into market‑ready therapies depends heavily on the availability of venture capital investment into biotechnology. Venture capital not only funds the high‑risk, high‑cost process of early development but also signals market confidence, attracting talent and enabling companies to progress from discovery to pivotal trials. Without robust capital ecosystems, promising ideas may stall long before they can benefit patients.
Global biotech VC figures reveal a stark imbalance in capital availability. According to DealForma, in 2024, the United States attracted approximately $19.9 billion in biotech venture capital, by far the largest pool globally [12]. The United Kingdom led Europe with roughly £2.06 billion ($2.6 billion) in biotech VC, accounting for about 28% of Europe’s total [13]. Canada’s life sciences sector secured around CAD 1.38 billion ($1.0 billion) [14], Australia raised about AUD 347 million ($225) in biotech and medtech [15], while Japan drew an estimated $240 million in biotech VC, up 380% YoY and 43% from its previous highs in 2019, but still small relative to its overall R&D investment and scientific potential [12]. China, once a rapidly rising force in biotech financing, saw only $1.0 billion in biotech VC in 2024, down sixfold from its 2021 peak [12].
These disparities have important implications for the shared responsibility model of global drug innovation. Nations seeking to contribute more equitably to the global innovation engine cannot rely solely on adjusting drug prices; they must also invest in deepening their venture ecosystems, ensuring sufficient capital is available to advance early‑stage science. Public subsidies, tax incentives, and translational infrastructure can help de‑risk projects, but without private capital to fund scaling and late‑stage development, scientific potential will remain underexploited. Venture capital is the bridge between laboratory breakthroughs and the therapies that ultimately reach patients, making it an indispensable complement to fair pricing in the architecture of global drug innovation.
4. Early‑Stage Clinical Translation Capacity
The number of Phase I trials initiated in any given country provides a useful proxy for the strength of its translational infrastructure. These trials represent the critical point at which an investigational therapy first enters human testing, converting preclinical hypotheses into real-world clinical evaluation. As such, they are a key marker of operational capacity, regulatory readiness, and investor confidence in the ability to execute early-stage development. A country's ability to consistently initiate Phase I INDs suggests that it is not only producing scientific ideas but is also equipped to advance them toward commercial viability.
Because official counts of Phase I INDs are not consistently reported across all national registries, we estimated country-level volumes based on publicly available clinical trial databases (including ClinicalTrials.gov, ChiCTR, JPRN, and EU Clinical Trials Register), normalized to known global totals and adjusted for underreporting where applicable. For 2024, we estimated that China led with approximately 3,000 Phase I trials, accounting for over 40% of the global total. The United States followed closely, with around 2,800 trials or about 37% of global activity. Japan launched approximately 300 Phase I trials, while the United Kingdom, Australia, and Canada each initiated roughly 200 trials.
While the United States and China dominate in absolute volume, countries like Japan maintain strong activity relative to population size. The presence of 300 early-stage clinical trials per year in Japan reflects not only the country’s domestic drug discovery engine but also the maturity of its regulatory infrastructure, physician networks, and hospital systems that support complex study execution. This includes the PMDA's fast-track consultation system and a growing number of academic medical centers with translational capabilities.
5. Global Roots of Breakthrough Therapies
As discussed above, many important drug innovations such as checkpoint inhibitors and the SGLT2 class found commercial success in the United States but originated internationally. The story of Humira, the world’s best-selling drug for many years, follows this pattern. The therapeutic concept of targeting TNF-alpha was validated in the 1990s through academic studies in the United Kingdom and early clinical work undertaken in the Netherlands. The underlying monoclonal antibody technology was developed by Greg Winter at Cambridge Antibody Technology (UK), before being acquired and advanced by US-based Abbott (now AbbVie). Although commercial development and regulatory approvals were executed in the United States, the foundational intellectual property and scientific discoveries were multinational.
Crestor (rosuvastatin), one of the most widely prescribed statins globally, offers another example. The compound was originally discovered in the early 1990s in Osaka, Japan by Shionogi, based on internal research programs aimed at improving cholesterol-lowering efficacy with fewer side effects. Recognizing the global potential of the drug, Shionogi licensed rights to AstraZeneca in 1998, which undertook global clinical development and commercialization. At its peak, Crestor generated over $6 billion in annual sales and became the second best-selling statin worldwide, trailing only Lipitor. Despite being marketed and scaled from the West, the origin of the molecule was distinctly Japanese.
Finally, CAR‑T therapies further exemplify how transformative treatments emerge from decades of scientific progress across multiple geographies. The therapeutic concept traces its roots to early research in Israel, where immunologist Zelig Eshhar at the Weizmann Institute of Science first engineered T cells with chimeric antigen receptors (CARs) in the late 1980s, with his proof-of-concept study published in PNAS in 1989 [16]. Eshhar’s pioneering work demonstrated that T cells could be redirected to recognize and attack cancer cells, laying the conceptual foundation for the field. These first-generation CAR-T were tested in pre-clinical lab models in the early 1990s. This early science was further advanced by researchers in the United States, namely Michel Sadelain (Memorial Sloan Kettering), Carl June (UPenn), and Dario Campana (St. Jude’s). Carl June’s team refined the technology into what would become Kymriah (tisagenlecleucel). Developed in partnership with Novartis, Kymriah became the first FDA-approved CAR‑T therapy in 2017. While its clinical development was based in the United States, Novartis relied heavily on its Swiss manufacturing and global regulatory infrastructure to scale the product for international markets.
A parallel story unfolded with Carvykti (ciltacabtagene autoleucel), a BCMA-targeting CAR‑T therapy for relapsed/refractory multiple myeloma. Originally discovered and developed by Legend Biotech in China in 2015 with first-in-human clinical testing in China in 2016 (LEGEND-2), the therapy advanced through a global collaboration with Johnson & Johnson, ultimately receiving FDA approval in 2022. Legend’s success demonstrates the growing maturity of Asia’s biotech ecosystem, particularly in cellular therapy research and clinical execution.
These cases reinforce the point that drug development is not confined to a single geography or payer. Breakthrough targets often emerge from public laboratories and are validated through collaborative networks of translational research that span countries. The costs of early scientific risk are frequently absorbed by ecosystems that offer basic research funding, government support, and cost-effective infrastructure. The companies that scale these innovations often benefit from global infrastructure, public subsidies, and early scientific risk reduction, further de-risking development for those that ultimately drive marketing and commercialization.
A Multidimensional Index for Assessing Contributions to Drug Innovation
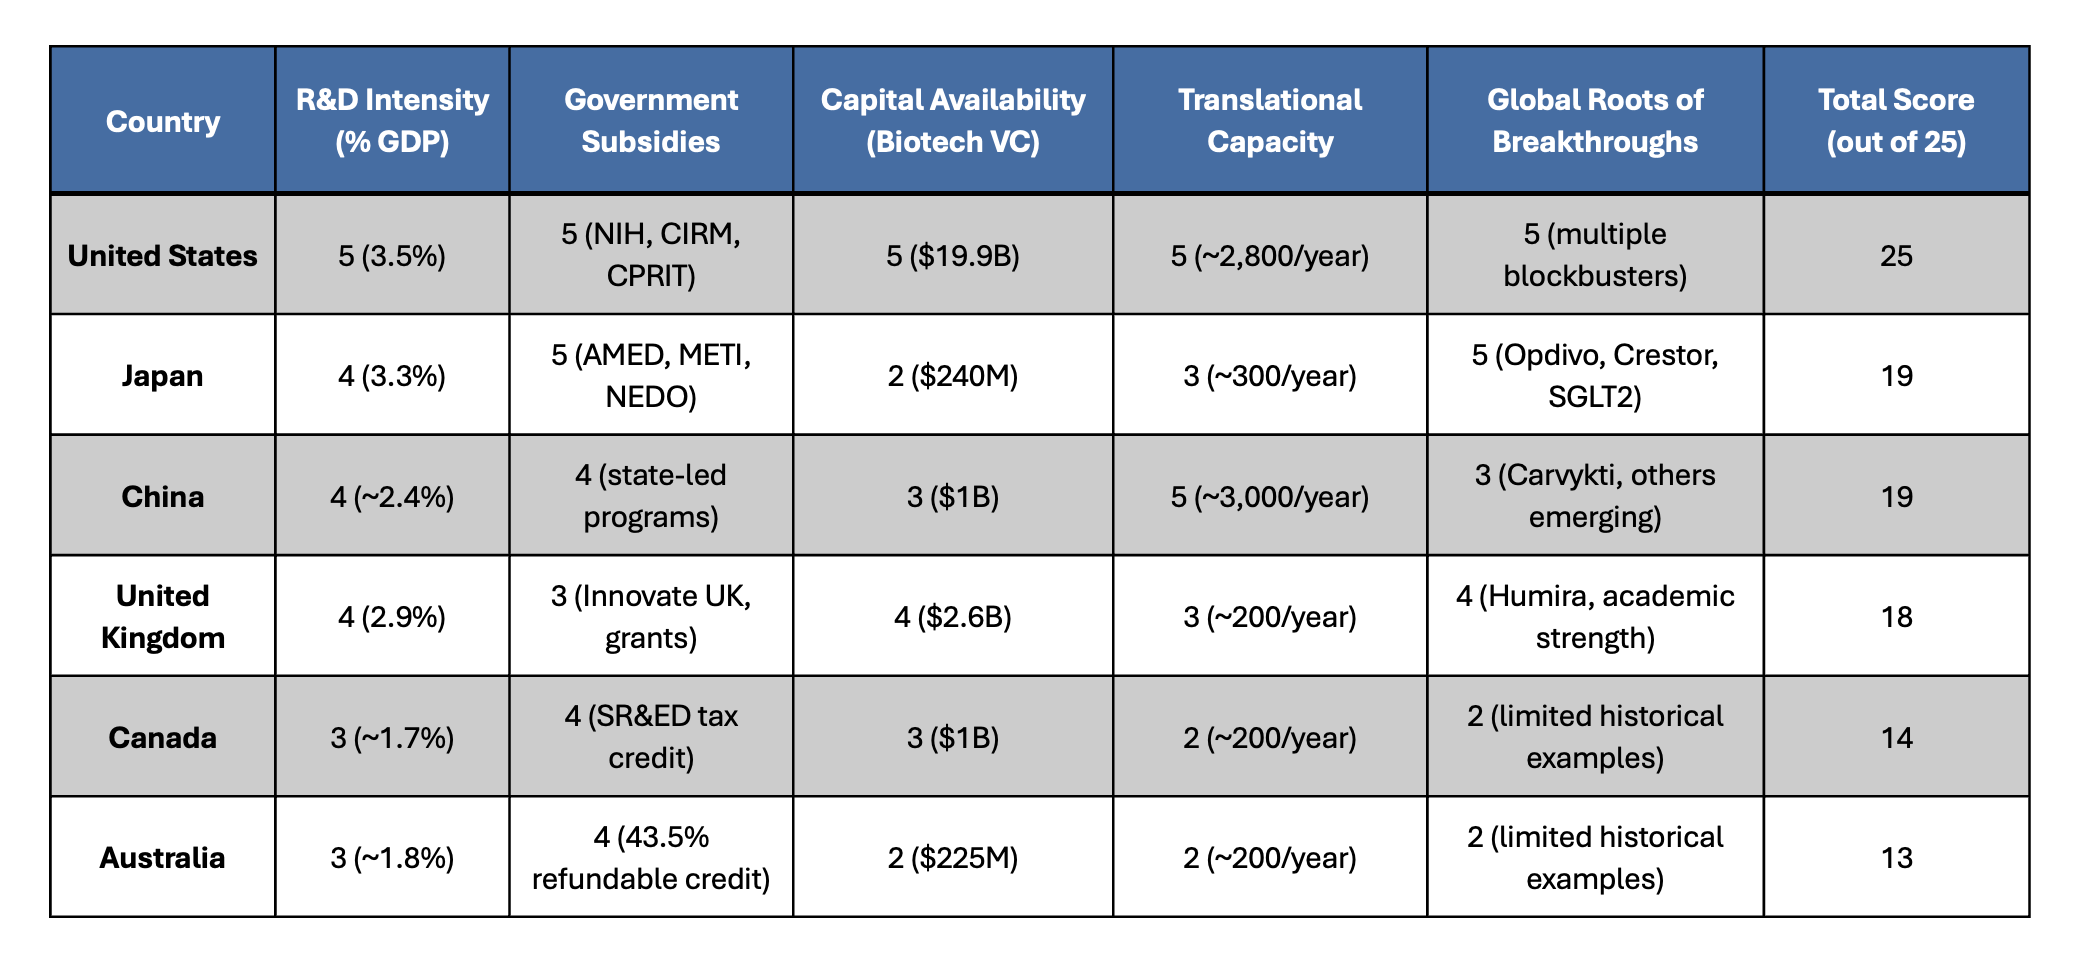
As a playful yet informative way to assess and visualize each country’s contribution to global drug innovation, we constructed a composite index based on the five dimensions highlighted in the article: (1) national R&D investment as a percentage of GDP, (2) scale and effectiveness of government subsidies for therapeutic development, (3) venture capital availability for biotech and life science, (4) strength of the clinical translation infrastructure, and (5) the historical origin of first-in-class drug discoveries. Each category was scored on a 1–5 scale to reflect relative performance, with a maximum total score of 25. This approach is not a comprehensive view, and is for illustrative purposes, but can offer a more holistic perspective of innovation contributions, capturing not just pricing, but rather early-stage risk absorption and translational capacity. Based on this index, the United States ranks highest due to its unmatched combination of public and private investment, clinical trial volume, and commercial impact. Japan and China follow closely, reflecting robust public subsidy systems, total capital availability, and growing clinical pipelines. The United Kingdom also scores well, particularly in foundational science. Canada and Australia round out the group, demonstrating strong support mechanisms, particularly through tax-based incentives, even if their absolute scale is smaller. Together, these metrics offer a more equitable framework for assessing how different countries help drive the global drug development engine.
In summary, sustaining global drug innovation requires a more comprehensive understanding of how scientific progress is financed and advanced, rather than simply looking at the end price paid. While pricing dynamics of the United States play an essential role in driving innovation, they represent only one piece of a broader, interconnected global system. Foundational research, early clinical translation, and technical de-risking often occur in other regions of the globe through public investment and institutional infrastructure. These factors play a critical role in driving innovation by mitigating early-stage risk, thereby enabling the entry of risk capital, and overcoming the initial inertia that often stalls translational progress. A balanced innovation model must recognize these diverse contributions and move beyond pricing alone as the primary measure of participation. Thus, to ensure the sustainability of this global innovation engine, we believe that nations should not only reevaluate their drug pricing policies, but also expand their direct investments into the enabling infrastructure. Only by acknowledging the full architecture of global risk-sharing can we build policies that both reward investment as well as ensure the continued discovery and development of transformative therapies.
References
1. Ho, K., & Pakes, A. (2025). Policy options for the drug pricing conundrum. Proceedings of the National Academy of Sciences of the United States of America, 122(9), e2418540122. https://doi.org/10.1073/pnas.2418540122
2. Kolchinsky, P., & Xie, R. (2024). The Great American Drug Deal. RA Capital Management.
3. Organisation for Economic Co-operation and Development (OECD), & United Nations Educational, Scientific and Cultural Organization (UNESCO). (2024). Research and development statistics. https://data.oecd.org/rd/gross-domestic-spending-on-r-d.htm
4. Public Spend Forum. (2023). SBIR/STTR – Trends and opportunities. https://resources.publicspendforum.net/hubfs/SBIR_STTR%20Summary%20Report.pdf
5. California Institute for Regenerative Medicine. (2025). CIRM Annual Report 2024. https://www.cirm.ca.gov/wp-content/uploads/2025/04/CIRM24_Annual-Report_low-res_single-pages.pdf
6. Cancer Prevention and Research Institute of Texas. (n.d.). Grants funded. https://www.cprit.texas.gov/grants-funded
7. Japan Agency for Medical Research and Development (AMED). (n.d.). https://www.amed.go.jp/en/
8. Canada Revenue Agency. (n.d.). Scientific research and experimental development (SR&ED). https://www.canada.ca/en/revenue-agency/services/scientific-research-experimental-development-tax-incentive-program.html
9. Australian Government. (n.d.). R&D tax incentive. https://business.gov.au/grants-and-programs/research-and-development-tax-incentive
10. Australian Taxation Office. (2024, May 21). Rates of R&D tax incentive offset. https://www.ato.gov.au/businesses-and-organisations/income-deductions-and-concessions/incentives-and-concessions/research-and-development-tax-incentive-and-concessions/research-and-development-tax-incentive/rates-of-r-d-tax-incentive-offset
11. UK Government. (2025, July 27). Research and development (R&D) tax relief: The merged scheme and enhanced R&D intensive support. https://www.gov.uk/guidance/research-and-development-rd-tax-relief-the-merged-scheme-and-enhanced-rd-intensive-support
12. Stifel Healthcare. (2025). Biopharmaceutical outlook for 2025. DealForma Database. https://www.stifel.com/newsletters/investmentbanking/bal/marketing/healthcare/biopharma_timopler/2025/BiopharmaMarketUpdate_Outlook_2025.pdf
13. BioIndustry Association. (2024). Annual Financing Report 2024. https://biotechfinance.org/wp-content/uploads/2025/01/BIA-Finance-report-2024-2.pdf
14. Canadian Venture Capital & Private Equity Association. (2025). Canadian venture capital market overview 2024. https://www.cvca.ca/wp-content/uploads/2025/02/CVCA_Q4_VC_Report98.pdf
15. Cutler, J., & Australian Startup Funding. (2024). The state of Australian startup funding report 2024. https://www.australianstartupfunding.com
16. Gross, G., Waks, T., & Eshhar, Z. (1989). Expression of immunoglobulin-T-cell receptor chimeric molecules as functional receptors with antibody-type specificity. Proceedings of the National Academy of Sciences of the United States of America, 86(24), 10024–10028. https://doi.org/10.1073/pnas.86.24.10024
17. Okuyama R. (2025). National Granted Programs and Public Funds for Biopharmaceutical Startups in Japan. Pharmacology research & perspectives, 13(3), e70106. https://doi.org/10.1002/prp2.70106
Share